As the future of the global economy increasingly shifts East and South, society needs a better lens to assess the world's principal motors of growth-cities. This Dashboard tracks 18 metrics across 30 cities from 14 geographical regions, in order to serve as a tool that supports city and business leaders in pursuit of a more holistic approach to urban development.
How to use this Dashboard
Cities that strive to be sustainable, fair, happy, innovative, data-driven, and responsive are well-positioned to be the most attractive hubs for talent. The Dashboard features two kinds of indicators under 6 pillars: progress metrics that highlight positive change over time and performance metrics based on the last year of data for a given indicator. Cities have also been classified under 6 archetypes according to GDP per capita and population growth rate to offer relevant points of comparison for cities in different stages of development as users consider replicating case studies that show how cities or countries catalyzed progress.
Measuring six pillars and corresponding indicators
Fair
Measures the availability and affordability of common infrastructure and individual necessities across incomes and demographics, as well as the degree to which cities protect the rights of all of their citizens.
UN Sustainable Develpment Goals


Happy
This pillar considers elements of a city that foster belonging and well-being, and also tries to capture a sense of socioeconomic progression.
UN Sustainable Develpment Goals


Sustainable
This pillar measures sustainable practices within a city (public transportation usage, circularity, electricity production) and concrete outcomes (e.g. air pollution).
UN Sustainable Develpment Goals


Data-driven
Cities that add digital intelligence and technological infrastructure to existing urban systems make it possible to do more with less.
UN Sustainable Develpment Goals


Innovative
The greater density of people, ideas, and resources in cities have made them centers of innovation throughout history.
UN Sustainable Develpment Goals

Responsive
This pillar focuses on how well cities anticipate, understand, and respond to their citizens' needs.
UN Sustainable Develpment Goals

Across six city archetypes
Low GDP per capita / Slow population growth
Casablanca, Rio de Janeiro
Low GDP per capita / Rapid population growth
Cairo, Lagos, Mumbai, Nairobi
Emerging economy / Slow population growth
Buenos Aires, Mexico City, San Salvador
Emerging economy / Rapid population growth
Istanbul, Jakarta, Johannesburg, Medellín, Manila
High GDP per capita / Slow population growth
Budapest, Copenhagen, Hong Kong, Montreal, New York, Paris, Seoul, Tokyo, Warsaw
High GDP per capita / Rapid population growth
Auckland, London, Riyadh, Shanghai, Singapore, Stockholm, Sydney
Key
Low GDP per capita
<$15,000
Emerging economy
$15,000 to $30,000
High GDP per capita
>$30,000
Rapid population growth
<1%
Slow population growth
>1%
Dynamic Cities Dashboard
Select a pillar
Case Studies
Filter by Pillar


Methodology
We selected cities based on a 3-step process. We began with McKinsey & Company's "City 600," the 600 cities contributing the most to global economic growth, responsible for 66% of projected GDP growth between 2015 and 2025. Then we defined 14 geographic regions for diverse representation, and filtered the "City 600" based on availability of public data, relative economic importance (i.e., GDP), and distinct demographic profiles.
This set of 18 foundational metrics was crafted over a 3-year research period in collaboration with the Bloomberg New Economy Dynamic Cities Coalition and Knowledge Partner McKinsey & Company, after initially identifying dozens more potential metrics. The exploration for a single publicly available data source for a majority of cities filtered the metrics down across the 6-point framework. The goal for this set of metrics was to highlight what we believe are important elements of city life that should be measured and tracked over time in order to drive productive change. These metrics are in no way exhaustive but are instead a starting point to build from while acknowledging the challenges in new primary data collection. For a complete list of the rationale behind each pillar and metric, missing data points, and further methodological information, see this Fact Sheet.


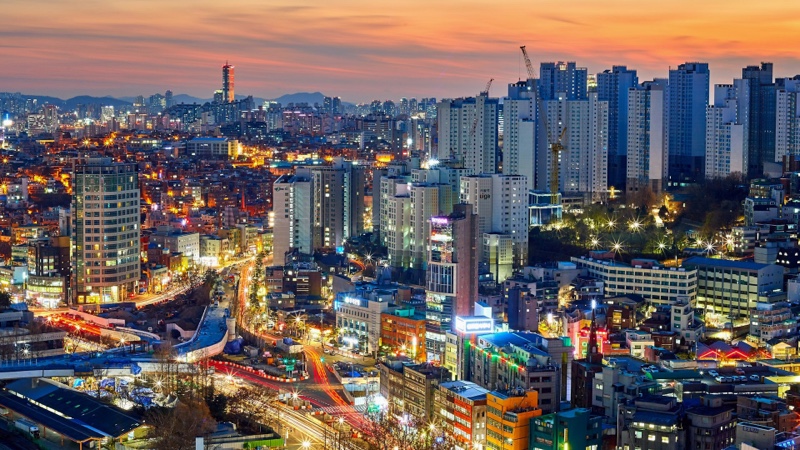
Indonesia
Jakarta
Rent Burden
-5.0%
Rent burden, defined as the proportion of income that goes to paying rent, stood at x% for a one bedroom apartment in Jakarta in 2023. Since 2018, rent burden has fallen 5% on average per year.
Urban GDP per capita
$10,116
Population Growth
$10,116

Slow Population Growth

Rapid Population Growth

Slow Population Growth

Rapid Population Growth

Slow Population Growth

Rapid Population Growth